
SocialPeta Advertiser Analysis & Top Charts Update (2020)
A historical look at SocialPeta's June 2020 update to Advertiser Analysis and Top Charts, covering redesigned analysis modules, creative-format insights, ranking trends, and competitor research workflows.
In 2020, SocialPeta continued iterating its advertising intelligence tools around the practical needs of marketers and advertisers. From April to May, updated versions of Advertiser Analysis and Top Charts were introduced with changes to information architecture, data visualization, rankings, and creative analysis.
This article documents those 2020 product changes and explains the workflows they were designed to support. The interface screenshots below are historical and should not be interpreted as the current SocialPeta product UI.
What Changed in Advertiser Analysis?
Clearer Analysis Function Distribution
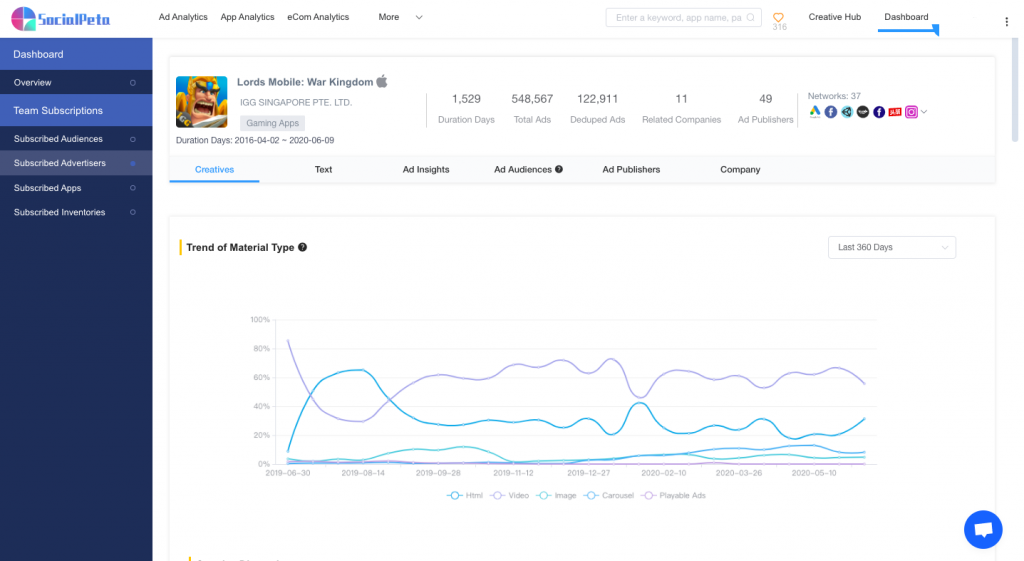
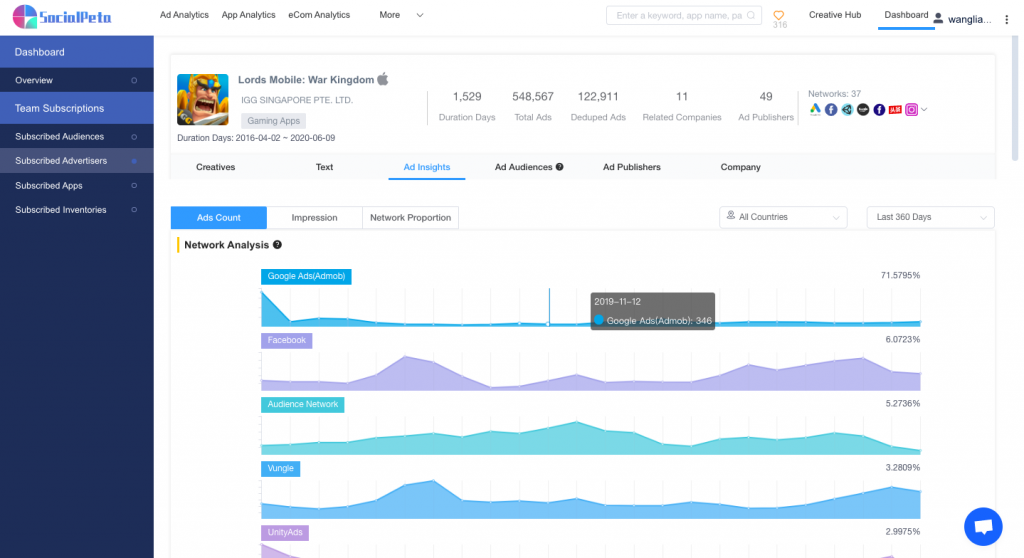
The updated Advertiser Analysis reorganized advertiser intelligence into six sections: Creatives, Text, Ad Insights, Ad Audiences, Ad Publishers, and Company. The goal was to make each analytical dimension easier to locate and allow users to focus on different parts of a competitor's advertising activity during different stages of campaign research.
A New Chart Display
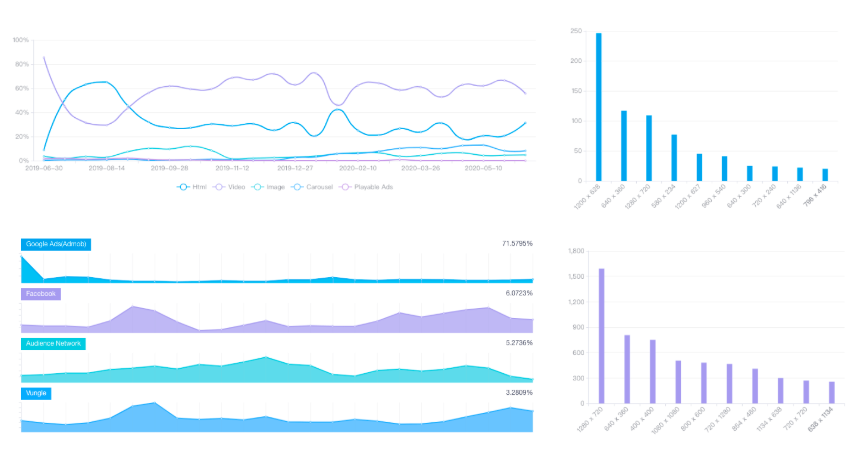
SocialPeta also revised the presentation of advertiser data. The updated charts were designed to make differences between data dimensions easier to compare and to make changes in advertising trends easier to browse over time.
Creative Format and Size Distribution
The 2020 update added a clearer view of the types of creatives an advertiser was running, including images, carousels, videos, HTML creatives, and playable ads. Looking at how this distribution changed over time could help marketers understand the creative formats competitors were favoring.
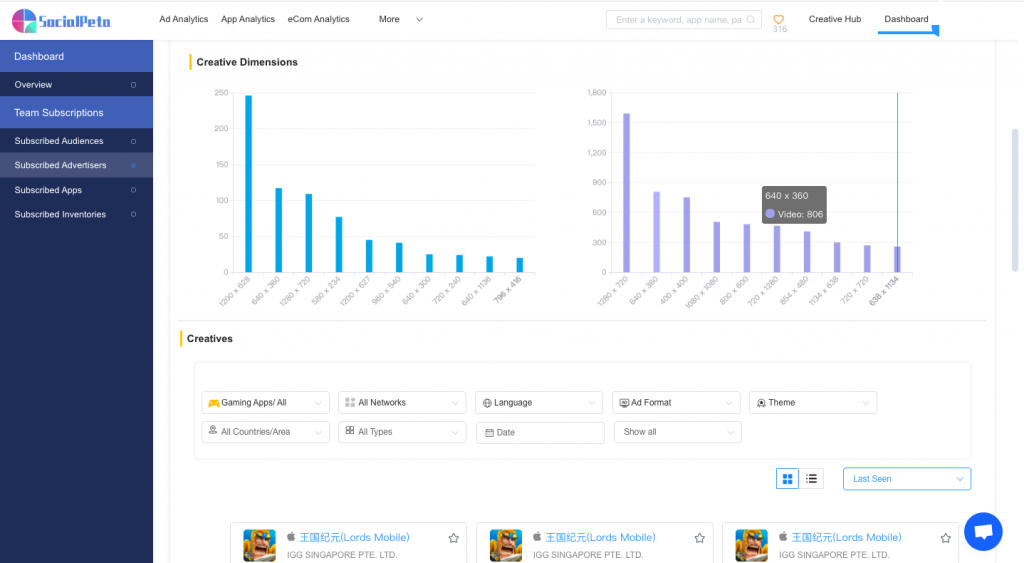
Creative-dimension distribution was added as another competitive signal. By comparing the proportions of different creative sizes, marketers could identify which ad layouts and specifications were most frequently used by an advertiser.
More Detailed Campaign Analysis
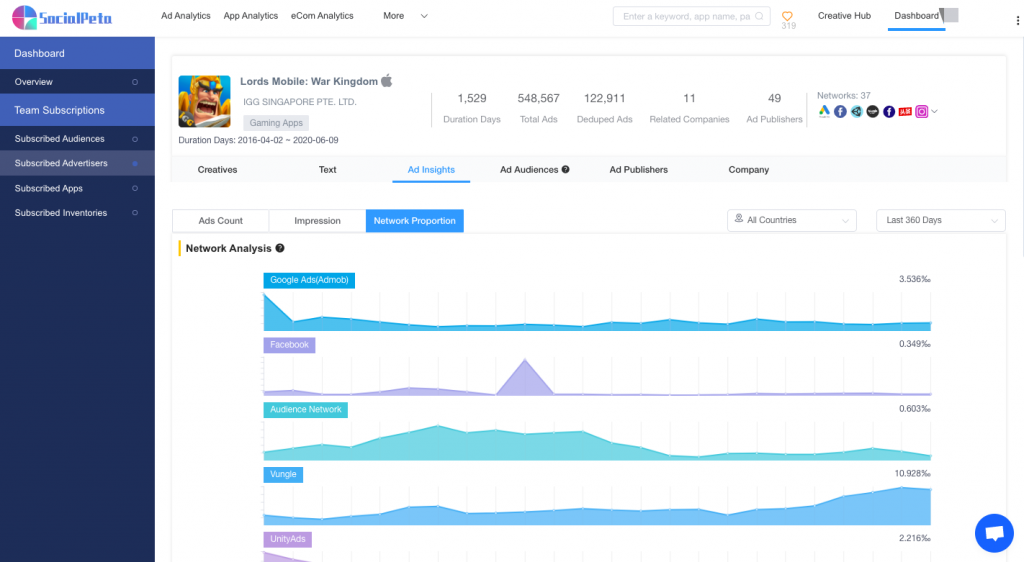
Delivery analysis was divided into three perspectives: creatives, impressions, and networks.
- Creative count showed the distribution of creatives used by an advertiser across channels under the selected conditions.
- Estimated impressions provided another perspective on the relative visibility of the advertiser's placements.
- Network proportion helped show how advertising activity was distributed among different ad networks.
What Changed in Top Charts?
Updated User Experience
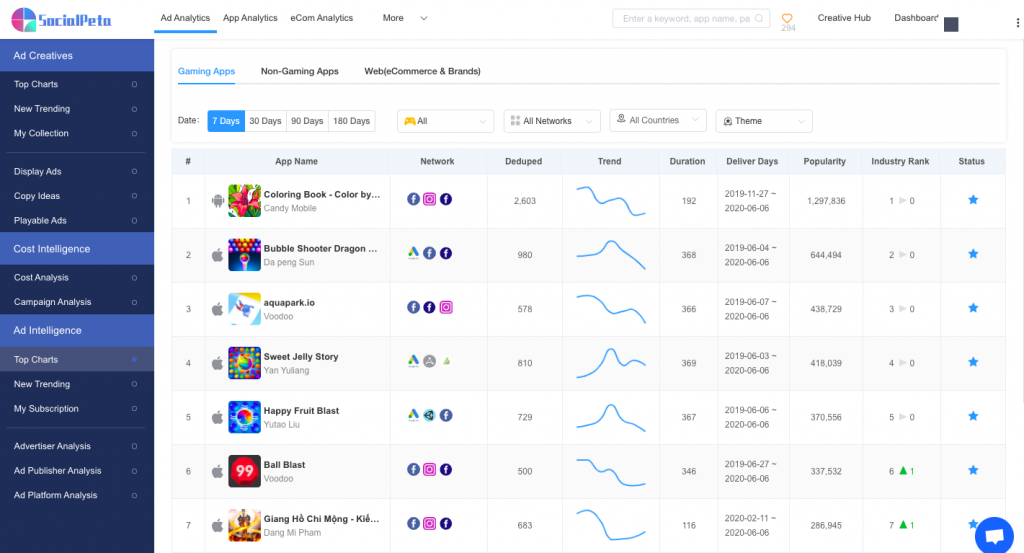
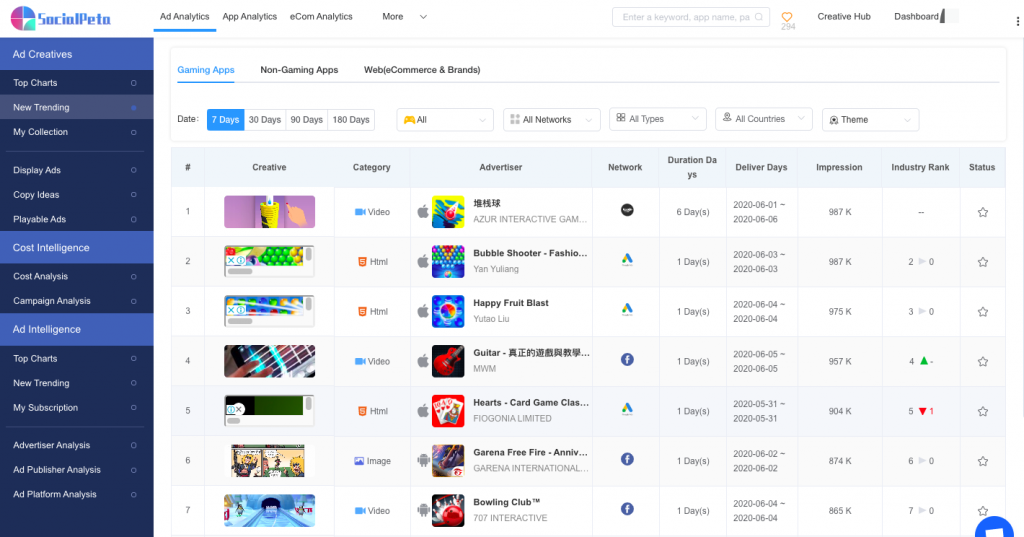
In April 2020, SocialPeta revised its advertiser and creative rankings. Filtering, table presentation, and other interface details were adjusted to make the charts easier to browse and compare.
More Focused Ranking Categories
Based on users' interest in both established market leaders and emerging products, the rankings were simplified into two broad perspectives: leading advertisers and new products.
The leading-advertiser rankings were intended to highlight high-impact competitors already active in the market, while the new product rankings helped users discover advertisers that were beginning to attract attention.
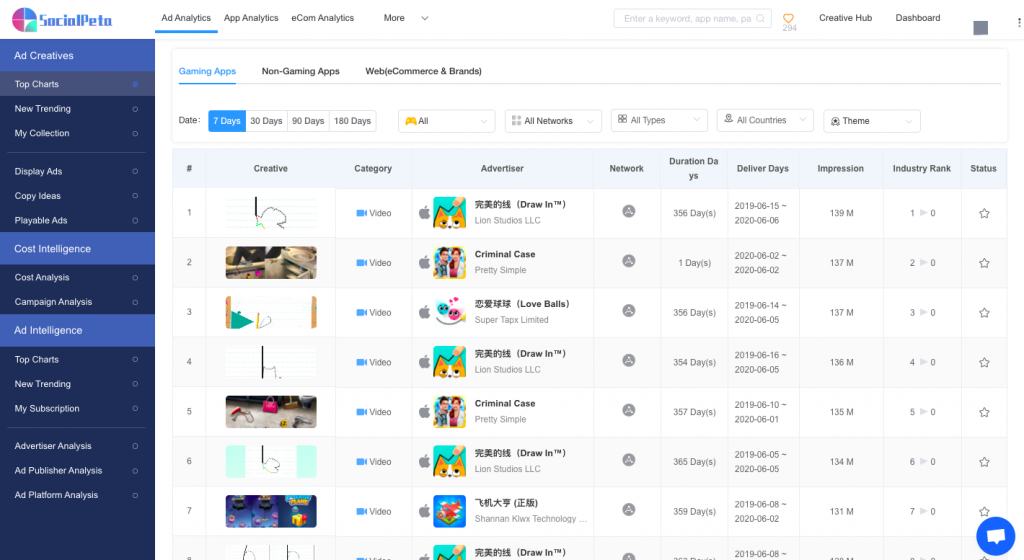
Both ranking perspectives were further divided into three industry groups: games, tools, and e-commerce. With SocialPeta's expansion into e-commerce intelligence at the time, the update also introduced rankings intended to help e-commerce users identify emerging advertisers and competitive products.
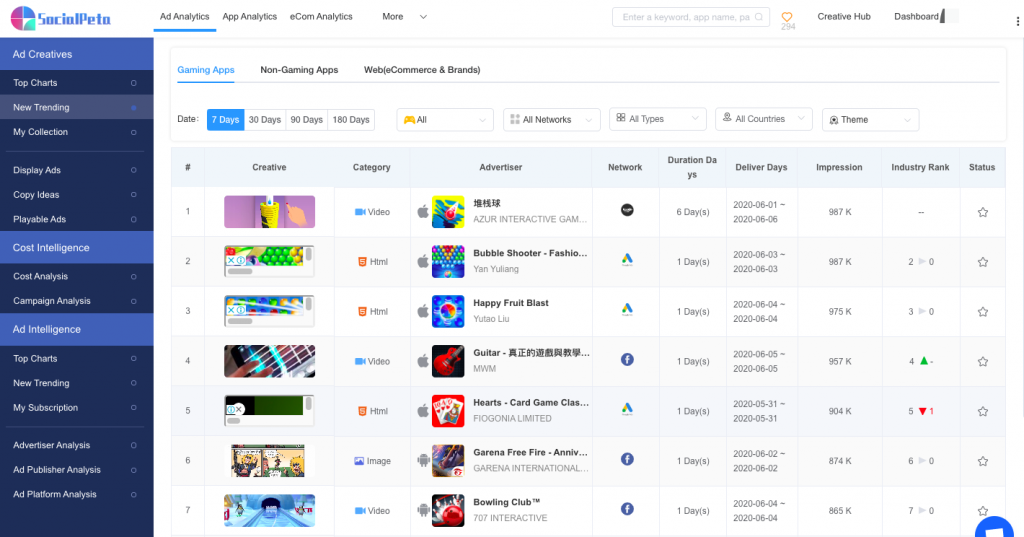
Visual Trend Metrics and Ranking Movement
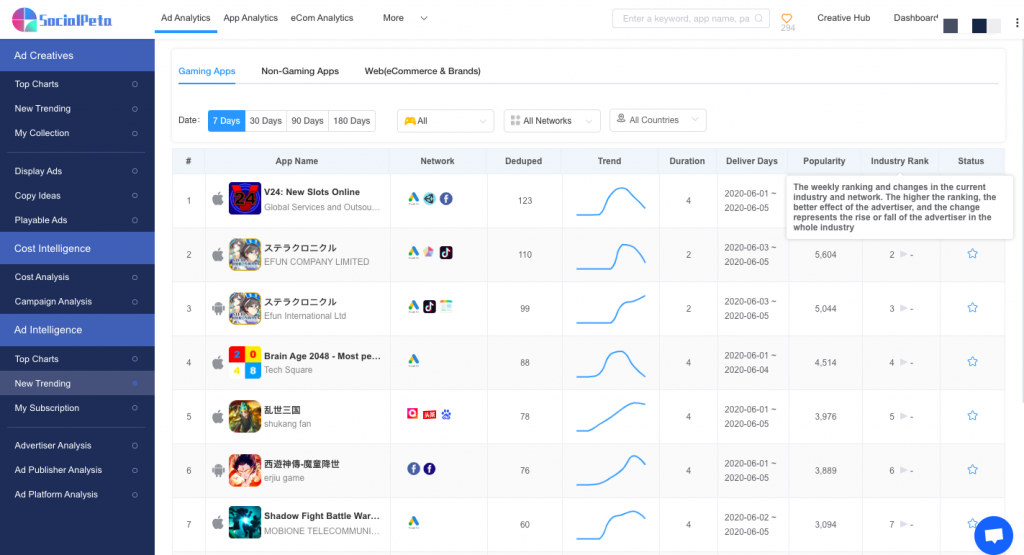
A new trend indicator was added to advertiser rankings so users could see recent changes in advertising activity alongside the ranking itself. This made movement within the rankings another signal to consider rather than treating each chart as a static snapshot.
SocialPeta recorded upward and downward movement for advertisers and creatives across ranking periods, making it easier to identify competitors whose momentum was changing.
What Could These Updates Help You Do?
Review Competitors' Delivery Strategies
Advertising optimization involves many interconnected decisions. The redesigned Advertiser Analysis attempted to map competitor research more clearly to different parts of the advertising workflow: creative production, copywriting, campaign delivery, channel selection, and audience strategy.
Instead of reviewing all competitor information in one undifferentiated view, users could move between analysis modules depending on the question they were trying to answer.
Evaluate Delivery Strategies Before Testing
A/B testing requires both time and budget. SocialPeta positioned advertiser delivery analysis as an additional source of competitive context before marketers committed resources to their own tests.
By comparing how similar advertisers distributed activity across networks and how those patterns changed over time, teams could form better-informed hypotheses about which approaches were worth testing. These competitive signals were intended as references, not guarantees of campaign performance.
Track Changes in the Industry
Broad advertiser databases can make it difficult to know which companies deserve attention. The updated rankings separated games, tools, and e-commerce so users could focus on competitors within the industry they cared about.
Historical advertising curves and ranking movement added a time dimension to this analysis. Users could observe when major advertisers became more active and whether their relative ranking was rising or falling.
Identify Emerging Competitors Earlier
The new-product advertiser rankings were designed to surface emerging competitors over shorter periods such as weekly or monthly views. Ranking by popularity helped users discover advertisers that might otherwise be overlooked when focusing only on established market leaders.
Find Creative Ideas That Perform in the Market
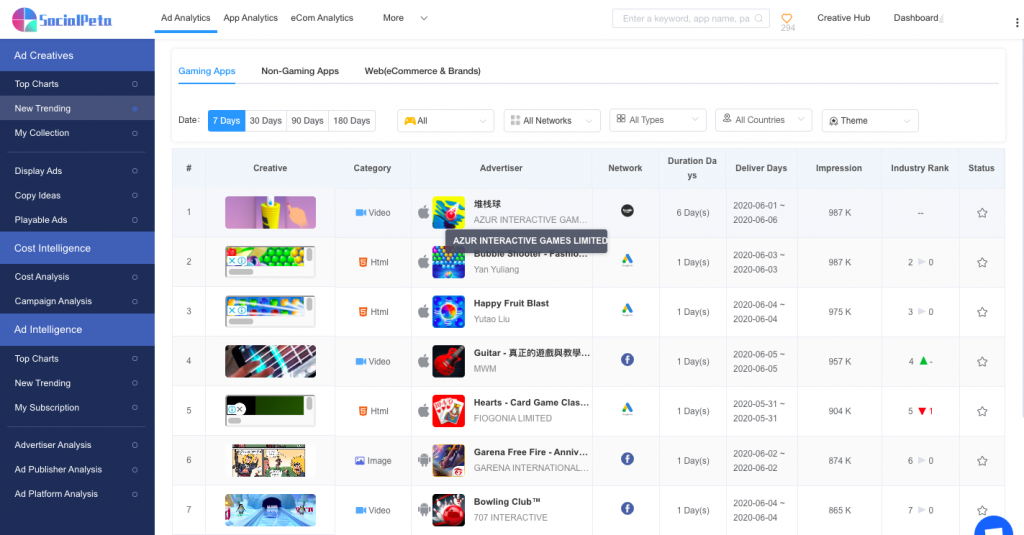
The creative rankings provided another way to study ideas that had remained active or achieved significant visibility. Rather than relying only on internal brainstorming, marketers could inspect market examples and look for recurring creative patterns worth studying.
Follow Newly Popular Creatives
Advertising trends can change quickly. The updated creative charts allowed users to look at recently popular creatives by time period, channel, and category, while ranking movement provided another clue about which concepts were gaining attention.
Summary
The 2020 revisions to Advertiser Analysis and Top Charts were designed to make competitive advertising research more structured: advertiser data was reorganized into clearer dimensions, creative formats and sizes became easier to compare, campaign delivery could be viewed from several perspectives, and rankings gained industry categories and trend indicators.
For marketers at the time, these changes were intended to make it easier to study competitor delivery strategies, identify emerging advertisers, monitor changes in advertising activity, and reference creative ideas that were already gaining market visibility.
This page is retained as a historical SocialPeta product-update article. For information about SocialPeta's current advertising research workflow, visit the current SocialPeta Ad Intelligence platform.