
Top advertisers: rankings, sources, and research methods
Compare top advertisers by market, period, and metric. Learn how to read spending rankings and build a relevant advertiser shortlist in SocialPeta.
Top advertisers are the companies or products that lead a defined advertising ranking. The answer changes with the country, period, channels, and metric: a global corporate spending list will not identify the same leaders as a mobile-game creative activity chart. To find useful benchmarks, choose the ranking that matches your decision, record its scope, and investigate the advertisers behind the positions.
Who are the top advertisers?
There is no single current list that covers every meaning of advertising leadership. Some reports rank companies by reported advertising expenses. Others estimate spending in monitored media, while app intelligence charts organize observed advertising activity. A company can lead one list and barely appear in another because the lists measure different things.
For a concrete, dated example, Nielsen's ranking of Australian advertisers for 2025 places Harvey Norman first, followed by Reckitt Benckiser and Amazon.com. Its New Zealand ranking for the same year starts with Harvey Norman, Foodstuffs NZ, and Woolworths. These are regional annual rankings, published in 2026, rather than a worldwide live leaderboard. See the original Australian advertiser report and New Zealand advertiser report.
The methodology matters as much as the names. Nielsen describes its measurement as gross advertising expenditure at published rate-card values in major media. Negotiated discounts are not openly available. You therefore cannot read the order as a list of audited net invoices, profitable campaigns, or the companies with the best creative teams.
If you need the biggest advertiser in your own category, begin with that category and market. An Australian retail benchmark may help a retail media seller. A US puzzle-game launch needs a different comparison set, even when an international retailer appears in both datasets. Relevance is the first filter, before rank.
Choose the ranking that answers your question
Write the question above the spreadsheet before collecting names. A media seller looking for prospects, a creative strategist looking for ideas, and a growth lead deciding whether to enter a market need different evidence. Combining their needs into one top-ten list usually makes the result harder to use.
| Research question | Appropriate ranking basis | What the ranking cannot establish |
|---|---|---|
| Which businesses have large advertising commitments? | Reported advertising expense or measured spend with stated scope | Current campaign profitability |
| Which apps show substantial advertising activity? | Observed app advertising within a defined sample | Audited media budget |
| Which competitors are entering our market? | Newly observed advertisers within comparable periods | The exact date the business began advertising |
| Which companies should our sales team investigate? | Relevant advertiser activity plus business and product fit | Buying intent or permission to contact a person |
| Which creative approaches deserve review? | Relevant advertisers followed by examination of individual ads | A winning message for your audience |
Keep the unit of analysis explicit. A corporate group can contain several brands, a store developer can publish several apps, and one app can advertise through several social Pages. A list mixing these levels can count the same business repeatedly. It can also make a diversified company appear comparable to one narrowly focused product.
For app markets, record the store and app identifier alongside the product name. If you later aggregate by developer, preserve the app rows underneath. Our ad publisher developer research guide explains why the developer shown in a store should not automatically be treated as the ultimate corporate parent.
Where to find top advertisers
Annual industry reports are useful for a broad spending picture. Read their geography, channel coverage, reporting period, and definition of spend before taking a number into a planning document. Check the underlying data year separately from the publication year. A page updated this month may still describe advertising from several years ago.
Company reports can help explain an individual business's investment, but accounting labels differ. A line called advertising and promotion may include costs absent from another company's advertising expense. Treat the original definition as part of the observation. Avoid building a precise league table by adding incompatible financial labels together.
Official ad libraries offer another kind of evidence: visible advertising. They help you inspect the messages and destinations associated with an advertiser. The Meta Ad Library is a practical starting point for Page-based research. An ad appearing there does not disclose that advertiser's profit or prove its total spending across other media.
Intelligence products help narrow a large market into a manageable research set. In SocialPeta, advertiser rankings sit within the Advertisers workflow. The ranking views include top advertisers, new advertisers, and a separate China outbound advertising view. Use each view for its stated purpose instead of treating them as interchangeable lists of the biggest companies.
Finally, compare public findings with your own account data. Your strongest benchmark might be an advertiser with a similar audience and offer, while your most useful measurement reference is still your own prior campaign under comparable conditions. External research helps decide what to investigate; first-party results determine what worked for you.
Build a shortlist in SocialPeta
Start in Top Advertisers and set the available filters to the research question. The ranking workflow supports channel filtering, displays selected conditions, and provides ranking tabs. Check the visible period and product context before comparing rows. Record the selected conditions with the list rather than saving advertiser names alone.
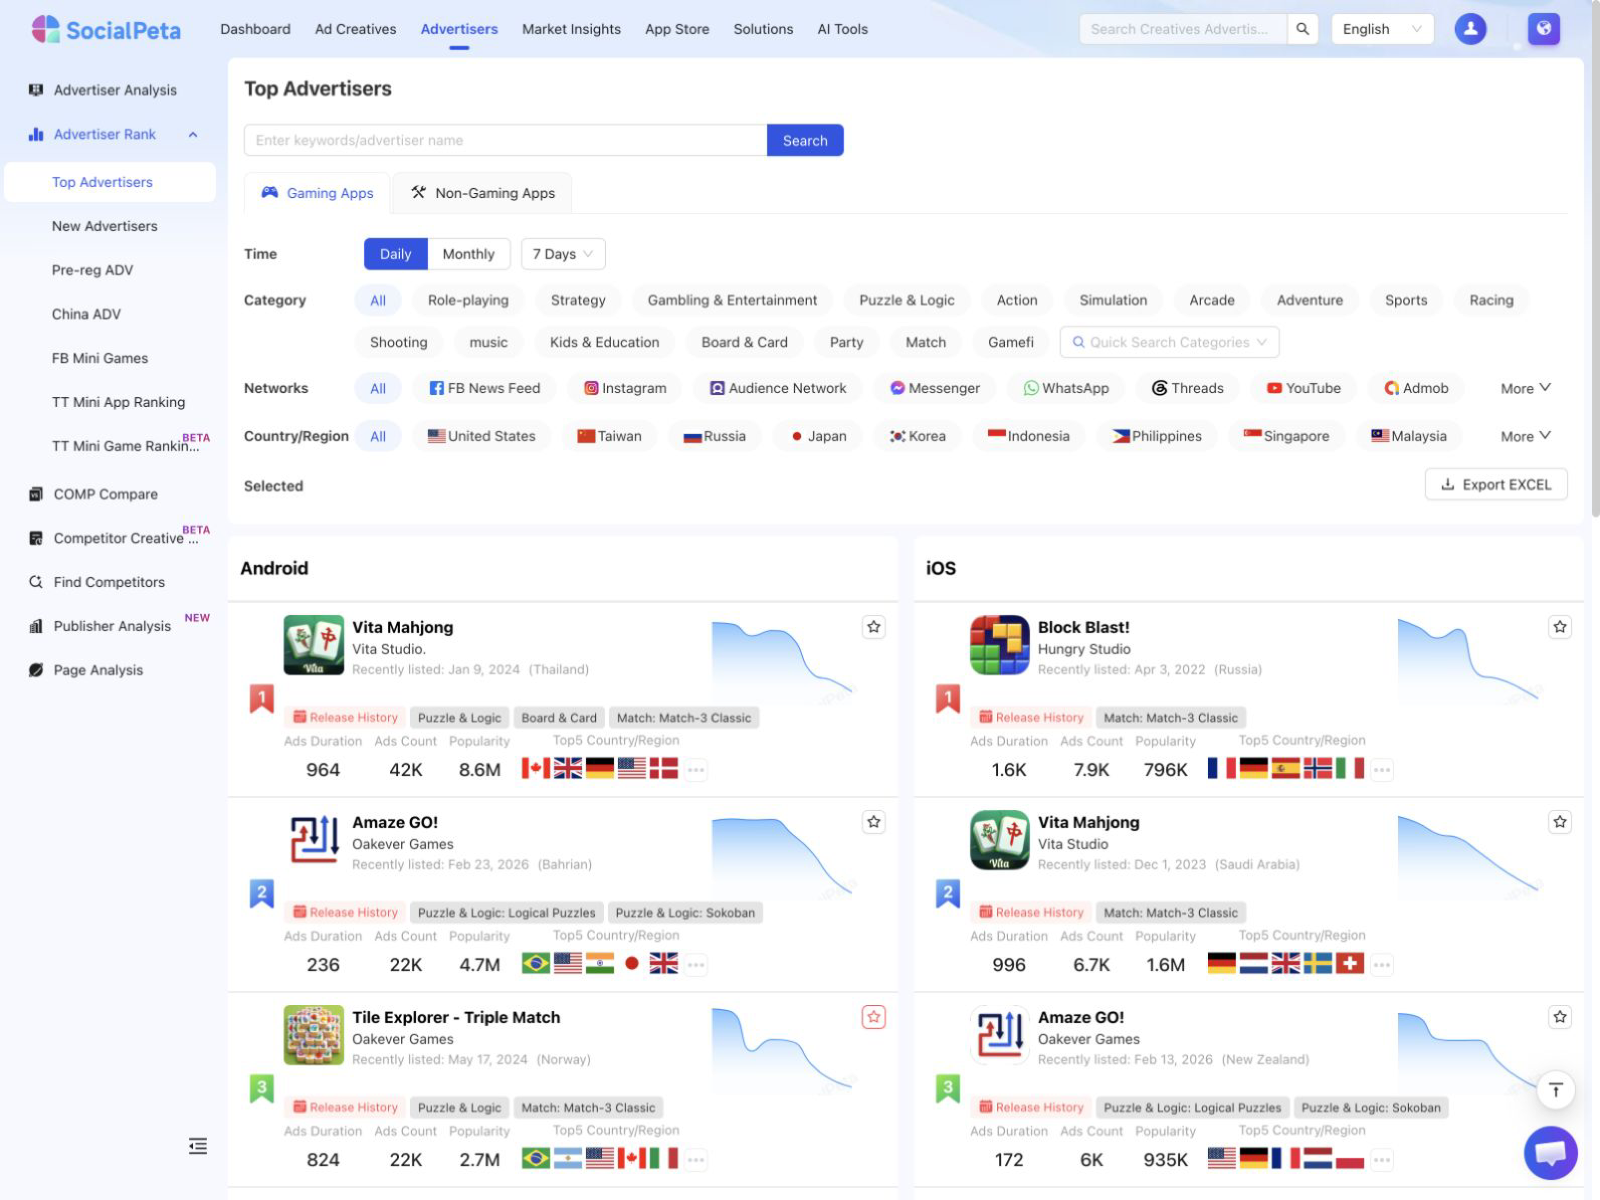
Use the export action when you need to discuss the shortlist with teammates. The ranking workflow supports an advertiser-app export based on current conditions. Add your research date and interpretation to the exported material so a recipient can reconstruct why the companies were included. An export without the selection rule becomes stale quickly.
Next, narrow the list by business relevance. Review whether each product serves a comparable need, operates in a market you can support, and uses an offer your business could plausibly deliver. A highly visible app with a different business model may still provide creative inspiration, but it should not become your spending benchmark.
Keep a small separate group of challengers. A newcomer can reveal a new promise or a neglected audience before it reaches the top of an established ranking. Newly observed activity is a reason to investigate, not proof that the developer or campaign itself is new. Observation depends on the dataset and the selected period.
An advertiser ranking is not a financial statement. When reporting findings, use the metric label shown in the product and retain its scope. If you cannot establish what a score represents, describe the advertiser as a shortlisted example from that view and avoid converting the score into money.
Read changes without inventing a growth story
A movement from tenth to fourth place sounds dramatic, but it does not by itself describe growth. The advertiser may have increased its activity, peers may have reduced theirs, or the comparison set may have changed. Inspect the underlying values and the cohort before writing an explanation.
Suppose a hypothetical sample contains 1,000 observed creatives, including 100 associated with App A. In a later comparable sample, the total is 500 and App A has 75. Its share of the observed sample rises from 10% to 15%, even though its count falls. Calling this a 50% increase in advertising volume would be wrong.
Label the calculation as share of observed creatives. Do not rename it share of spend or impression share. Nielsen's share-of-voice explainer describes a spending-based definition tied to category, market, channel, and time. Other systems use other denominators, so the label must travel with the calculation.
Check whether one concept has many executions. Localized copies, aspect-ratio versions, or repeated ads may inflate a raw count relative to the number of distinct ideas. Conversely, a small visible creative set may support substantial delivery. Creative production volume and media allocation are separate questions.
Use equal periods for recurring reviews. Note seasonality, product launches, promotions, and known changes in your own sampling. If the source changes its coverage or metric, begin a new series or annotate the break. A smooth chart should never conceal that the underlying measurement changed.
Turn the shortlist into an advertising decision
For each advertiser, inspect the relationship between the product promise and the next step. What does the opening ask the viewer to care about? What evidence supports the promise? Does the destination deliver what the ad suggested? These questions help explain an execution without requiring access to confidential campaign results.
A hypothetical language-learning app might find three highly visible competitors emphasizing short daily lessons. The useful response is not to repeat the same headline. Compare how each demonstrates learning, who appears in the ad, and what happens after the click. Your product may have a stronger demonstration of conversational practice than of speed.
Write a test proposal that states the uncertainty: a short conversation demonstration may help hesitant beginners understand the product better than a feature list. Specify the original asset you will create, the audience, the destination, and the qualified action you will measure. Keep the claim limited to what your product can actually show.
Do not expand spending because the reference advertiser has been visible for months. Longevity can reflect many circumstances, including modest delivery, repeated campaigns, or a brand objective. Treat it as a reason to examine the creative carefully. Validation still needs your own campaign outcomes and a comparison appropriate to the decision.
For detailed creative sampling, use the ad research workflow. For business positioning, move to competitive research for marketing decisions. Those are different follow-up jobs; neither requires copying the advertiser that happens to rank first.
Keep a ranking record that another person can review
A useful research record fits on one page. Include the business question, source, observation date, period, geography, channel coverage, unit of analysis, metric, selected advertisers, and exclusions. Add a short note explaining which decision the list is expected to inform and which claims it cannot support.
| Record field | Example entry for a hypothetical study |
|---|---|
| Decision | Select reference apps for a new creative brief |
| Comparison unit | Individual Android app, identified by package |
| Scope | One game category, one country, one observed period |
| Selection | Relevant high-activity examples plus emerging challengers |
| Exclusion | Different business model or unavailable destination |
| Next action | Review promise and proof; propose an original test |
Give exclusions the same care as inclusions. A large advertiser omitted because it sells a different product is not an oversight. Stating the reason prevents the next reviewer from putting it back merely because its name is familiar. Keep a separate note if it is useful for another purpose, such as studying visual craft.
Schedule the next review around the decision. A launch team may need frequent checks during a short research window; an annual market overview does not need daily reshuffling. Reopen the shortlist when a relevant competitor enters, an offer changes, or the source scope changes. The goal is a more informed next action, not a permanently moving league table.
Before sharing, read every use of biggest, leading, top, and growing. Each should point to a named metric and a defined context. If the evidence only supports visible activity, say visible activity. That discipline makes an advertiser ranking useful to colleagues who were not present when the research was collected.
Frequently asked questions
Who are the top advertisers?
The answer depends on geography, period, channels, and metric. For example, Nielsen ranked Harvey Norman first in its Australian and New Zealand advertiser lists for 2025. Those regional gross-spend rankings are not a universal list of current global leaders.
Does a high advertiser ranking mean a large ad budget?
Only when the ranking explicitly measures spending under a stated methodology. Rankings based on observed creatives, popularity, or other activity signals cannot be converted into audited budgets.
How do I choose top advertisers to study?
Match the market, product category, business model, channel, and period to your decision. Keep app, developer, brand, and corporate-group identities separate, then review the ads and destinations of a relevant shortlist.