Blood Pressure Log: Hypertension chart and journal Competitive Intelligence|Ad Analysis by SocialPeta
Competitive intelligence is the first step in our marketing intelligence work and one of the most important parts. Only when we understand the details of our competitors can we formulate a correct and effective marketing strategy.
In this report, SocialPeta analyzes the Blood Pressure Log: Hypertension chart and journal's ad analysis from multiple aspects and helps you see the competitive intelligence of top grossing apps Blood Pressure Log: Hypertension chart and journal.
Now, I'll tell you how to gain a competitive advantage by SocialPeta.
1. Basic Information of Blood Pressure Log: Hypertension chart and journal
App Name : Blood Pressure Log: Hypertension chart and journal
Logo:
OS : Android
Network : Facebook,Audience Network,Instagram
Developer : RodXander
Publisher : Instagram,Facebook,Météo Pollen,ダイエット やせるレシピ - byクックパッド ダイエット
Total creative ads during the time period : 149
Duration : 391
Popularity : 16,313
Check ASO Keywords of Blood Pressure Log: Hypertension chart and journal
2. Blood Pressure Log: Hypertension chart and journal’s Competitive Intelligence
what is competitive intelligence? Competitive intelligence is the most important part of our marketing. Only when we fully understand the overall situation of our competitors and the market can we make accurate judgments.
Before advertising, we usually use various tools, such as SocialPeta, to check the details of competitors' ads. In this report, we will analyze the recent advertising performance of advertiser Blood Pressure Log: Hypertension chart and journal in detail to understand its advertising strategy.
Trend of Category
There are many types of creatives. We mainly analyze the trend of the ad creative category of Blood Pressure Log: Hypertension chart and journal in the recent period. As of 2021-03-15, among the Blood Pressure Log: Hypertension chart and journal‘s ad creative, the Html category's proportion is 0.0%, Video category's proportion is 0.0%, Playable Ads category's proportion is 0.0%, Image category's proportion is 100.0%, Carousel category's proportion is 0.0%.
Ad Network Analysis
The network that SocialPeta monitors can cover almost all mainstream channels in the world. Understanding the competitor's advertising channels is the first step in marketing work. According to the analysis of SocialPeta, we can see that in the date of 2021-03-15, Blood Pressure Log: Hypertension chart and journal's the proportion of networks impressions are placed like this:
Facebook's proportion is 25.25%,
Instagram's proportion is 25.22%,
Audience Network's proportion is 24.97%,
Messenger's proportion is 24.56%,
's proportion is .
In the date of 2021-03-15, Blood Pressure Log: Hypertension chart and journal‘s network with the most ads is Facebook and its proportion is 25.0%.
3. Top 3 Ad Creative Analysis of Blood Pressure Log: Hypertension chart and journal
This is the detailed information of the top three ad creatives with the best performance among all ad creatives of Blood Pressure Log: Hypertension chart and journal. We can see some advertising trends.
Top 1 Ad Creative of Blood Pressure Log: Hypertension chart and journal
Ad Details :
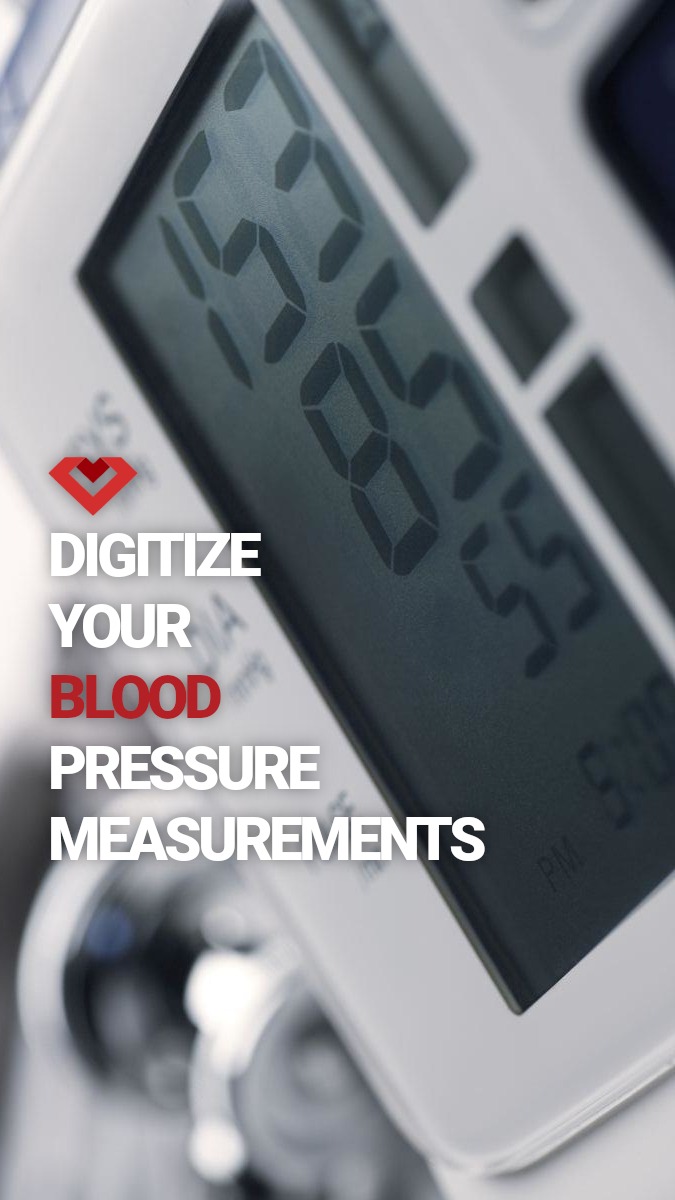
Headline :Manage your blood pressure.
Text :💓Fight hypertension the smart way💓 Download Blood Pressure App for free and handle your blood pressure more easily.
Top 2 Ad Creative of Blood Pressure Log: Hypertension chart and journal
Ad Details :
Headline :Manage your blood pressure.
Text :💓Fight hypertension the smart way💓 Download Blood Pressure App for free and handle your blood pressure more easily.
Top 3 Ad Creative of Blood Pressure Log: Hypertension chart and journal
Ad Details :
Headline :Manage your blood pressure.
Text :💓Fight hypertension the smart way💓 Download Blood Pressure App for free and handle your blood pressure more easily.
Basic Info of Top 3 Ad Creative
| 1st | 2nd | 3rd | |
| Duration | 60 | 60 | 60 |
| Popularity | 223 | 221 | 220 |
| Dimensions | 675 x 1200 | 675 x 1200 | 675 x 1200 |
| Creative Type | Image | Image | Image |
| Network | Audience Network | Messenger | |
| Related Ads | 2 | 2 | 2 |
| Countries | Argentina,Sri Lanka,Germany,Ethiopia,Norway,Kenya,Australia,Taiwan,Albania,Turkey,Somalia,Kuwait,United Kingdom,Hong Kong,Portugal,Saint Vincent and the Grenadines,Oman,Macau,New Zealand | Argentina,Sri Lanka,Germany,Ethiopia,Norway,Kenya,Australia,Taiwan,Albania,Turkey,Somalia,Kuwait,United Kingdom,Hong Kong,Portugal,Saint Vincent and the Grenadines,Oman,Macau,New Zealand | American Samoa,Costa Rica,Israel,Argentina,Indonesia,Uzbekistan,Bangladesh,Belize,Mongolia,Trinidad and Tobago,Turkey,Ethiopia,Sri Lanka,Azerbaijan,Germany,Italy,Guyana,Korea,Colombia,Kenya |
| Language | English | English | English |
Through the above analysis, we can see that the most effective channel for Blood Pressure Log: Hypertension chart and journal in recent advertising is Facebook, and the main creative type is Image.
In conclusion: The above is a free Blood Pressure Log: Hypertension chart and journal's competitive intelligence analysis report. To do a good job of advertising, long-term accumulation is required. we need to constantly check the latest trends and competitive intelligence data. With the use of competitive intelligence tools like SocialPeta, Guangdada(Chinese version of SocialPeta), we can improve our ROI, and make competitor‘s fans ours. I hope that this ad creative analysis report will allow you to gain more.
If you want to check the relevant intelligence analysis of other apps similar to Blood Pressure Log: Hypertension chart and journal, you can click the app name below to view related reports, or you can find more info in ASOTools.