teamLab Competitive Intelligence|Ad Analysis by SocialPeta

Competitive intelligence is the first step in our marketing intelligence work and one of the most important parts. Only when we understand the details of our competitors can we formulate a correct and effective marketing strategy.
In this report, SocialPeta analyzes the teamLab's ad analysis from multiple aspects and helps you see the competitive intelligence of top grossing apps teamLab.
Now, I'll tell you how to gain a competitive advantage by SocialPeta.
1. Basic Information of teamLab
App Name : teamLab
Logo:
OS : Android
Network : Instagram,Facebook,Messenger
Developer : teamLab Inc.
Publisher : Instagram,Facebook,高速安全浏览器-超快上网最极速省流量的浏览器,Play Canasta and Burraco,图片格式转换大师,JPEG<—>PNG,Canasta - Card Game
Total creative ads during the time period : 202
Duration : 241
Popularity : 13,322
Check ASO Keywords of teamLab
2. teamLab’s Competitive Intelligence
what is competitive intelligence? Competitive intelligence is the most important part of our marketing. Only when we fully understand the overall situation of our competitors and the market can we make accurate judgments.
Before advertising, we usually use various tools, such as SocialPeta, to check the details of competitors' ads. In this report, we will analyze the recent advertising performance of advertiser teamLab in detail to understand its advertising strategy.
Trend of Category
There are many types of creatives. We mainly analyze the trend of the ad creative category of teamLab in the recent period. As of 2021-03-15, among the teamLab‘s ad creative, the Html category's proportion is 0.0%, Video category's proportion is 0.0%, Playable Ads category's proportion is 0.0%, Image category's proportion is 100.0%, Carousel category's proportion is 0.0%.
Ad Network Analysis
The network that SocialPeta monitors can cover almost all mainstream channels in the world. Understanding the competitor's advertising channels is the first step in marketing work. According to the analysis of SocialPeta, we can see that in the date of 2021-03-15, teamLab's the proportion of networks impressions are placed like this:
Google Ads(Admob)'s proportion is 100.0%,
's proportion is ,
's proportion is ,
's proportion is ,
's proportion is .
In the date of 2021-03-15, teamLab‘s network with the most ads is Google Ads(Admob) and its proportion is 100.0%.
3. Top 3 Ad Creative Analysis of teamLab
This is the detailed information of the top three ad creatives with the best performance among all ad creatives of teamLab. We can see some advertising trends.
Top 1 Ad Creative of teamLab
Ad Details :

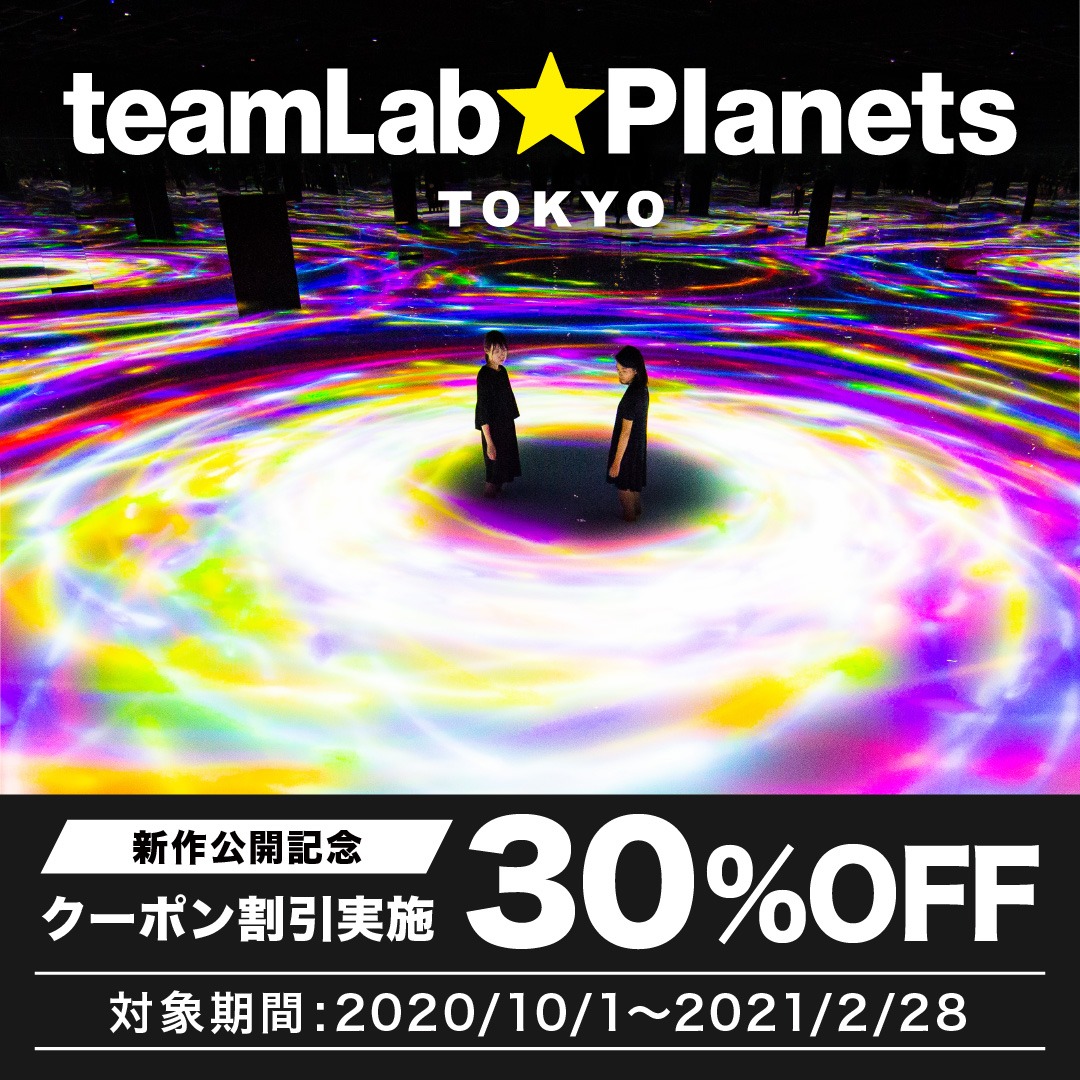
Headline :teamLab Planets TOKYO
Text :【新作公開記念・クーポン割引実施】 公式サイトにて使用できる期間限定クーポンでチケット代30%OFF! 大人チケットの場合、 価格が¥3,200円→¥2,240円に!! 入館制限等の感染防止策を実施の上で、ミュージアムをオープン中 詳しくは公式サイトをご確認ください。
Top 2 Ad Creative of teamLab
Ad Details :
Headline :
Text :【新作公開記念・クーポン割引実施】
公式サイトにて使用できる期間限定クーポンでチケット代30%OFF!
大人チケットの場合、
価格が¥3,200円→¥2,240円に!!
入館制限等の感染防止策を実施の上で、ミュージアムをオープン中
詳しくは公式サイトをご確認ください。
Top 3 Ad Creative of teamLab
Ad Details :

Headline :
Text :【新作公開記念・クーポン割引実施】
公式サイトにて使用できる期間限定クーポンでチケット代30%OFF!
大人チケットの場合、
価格が¥3,200円→¥2,240円に!!
入館制限等の感染防止策を実施の上で、ミュージアムをオープン中
詳しくは公式サイトをご確認ください。
Basic Info of Top 3 Ad Creative
| 1st | 2nd | 3rd | |
| Duration | 90 | 33 | 33 |
| Popularity | 281 | 160 | 160 |
| Dimensions | 640 x 640 | 1080 x 1080 | 1080 x 1920 |
| Creative Type | Image | Image | Image |
| Network | |||
| Related Ads | 2 | 1 | 1 |
| Countries | Japan | Japan | Japan |
| Language | Japanese | Japanese | Japanese |
Through the above analysis, we can see that the most effective channel for teamLab in recent advertising is Instagram, and the main creative type is Image.
In conclusion: The above is a free teamLab's competitive intelligence analysis report. To do a good job of advertising, long-term accumulation is required. we need to constantly check the latest trends and competitive intelligence data. With the use of competitive intelligence tools like SocialPeta, Guangdada(Chinese version of SocialPeta), we can improve our ROI, and make competitor‘s fans ours. I hope that this ad creative analysis report will allow you to gain more.
If you want to check the relevant intelligence analysis of other apps similar to teamLab, you can click the app name below to view related reports, or you can find more info in ASOTools.