SocialPeta and TopOn Release the White Paper on Global Mobile Game Advertising and Monetization (H1 2020)
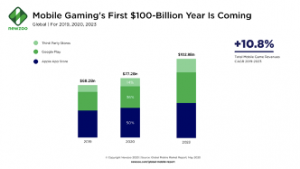
While COVID-19 is crushing the global economy, mobile gaming is poised for a new wave of growth. Newzoo’s latest data shows mobile gaming markets around the globe will generate USD77.2 billion in revenue this year, a 13% year-on-year increase. The App Store will generate USD38.8 billion in mobile gaming revenue this year (up 10.3% year-on-year), and gaming revenue from Google Play will also reach USD27.8 billion in 2020 (up 15% year-on-year). In addition, global mobile game downloads will also hit a record high in H1 2020, according to multiple data sources at home and abroad.
H1 2020 sees an explosive growth in global mobile game downloads and revenue, but it is quite a different situation for mobile game advertising and monetization. Recently, SocialPeta, a global leading advertising intelligence analysis tool, and TopOn, a global mobile advertising aggregation tool, jointly released the White Paper on Global Mobile Game Advertising and Monetization (H1 2020), which, drawing on the global mobile game advertising creative and monetization data of January-June 2020 from both platforms, reveals the advertising marketing data performance of global mobile gaming in H1 2020 under the impact of COVID-19 through a probe into ten countries, and predicts the trend of the global market in H2 2020 with the normalization of the pandemic.
The following is an excerpt from the white paper. For the full version, please click the White Paper on Global Mobile Game Advertising and Monetization (H1 2020).
Advertising
SocialPeta has accumulated over 700 million pieces of advertising data around the globe, updating up to one million pieces of advertising data on a daily basis. Based on this huge database, the SocialPeta team offers an insight into the overall trend of global mobile game advertising in H1 2020.
Overview of Global Mobile Game
Advertising
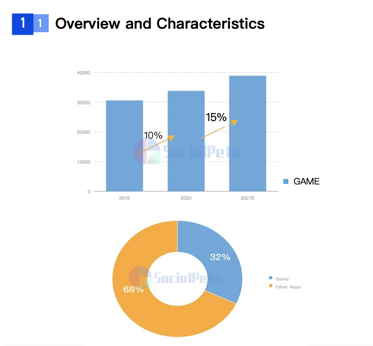
In H1 2020, game advertisers increased by 10% year-on-year, accounting for 32% of all apps. It is estimated that in H1 2021, there will be 40k active advertisers around the globe, a 15% increase compared with 2020. With COVID-19 spreading to the world in early 2020, active advertisers fell into significant decline from January, and the largest quarter-on-quarter decline was in February, representing 3.82%.
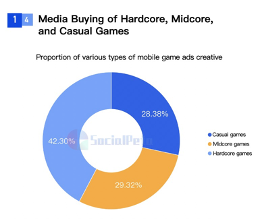
The media buying for hardcore games are the largest media buyer, taking 42.30% of all creative. Casual and midcore games take a similar share, about 30% of all types of creative.
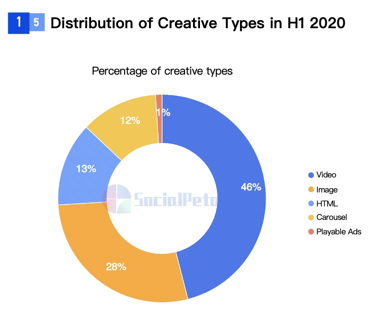
Most of the ad creative in H1 2020 was video creative, occupying 46%, followed by image creative, occupying 28%. Meanwhile, dynamic creative (videos, playable ads) is favored by increasing advertisers because of their richer display and better interactivity; with the development of the mobile Internet around the globe and lower rates for mobile Internet services, dynamic creative will occupy a higher and higher proportion, which is already close to 50% in 2020.
Global Hot Networks and
Countries/Regions
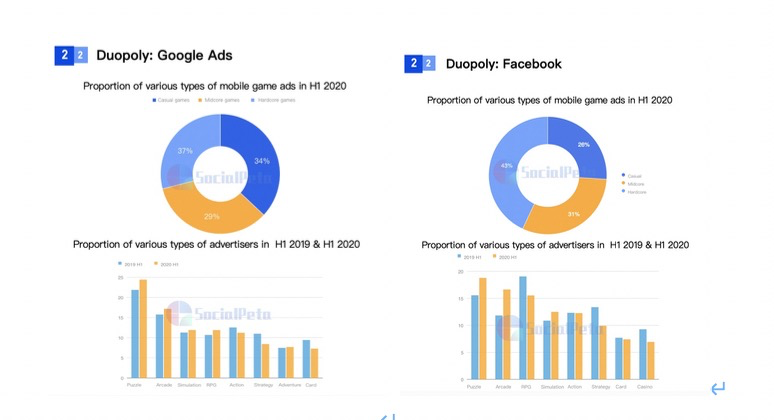
Among ad networks, Google Ads and Facebook hold a dominant position on Android and iOS, respectively.
Google Ads has relatively balanced game genres, of which puzzle games are the most represented and the fastest-growing advertiser, growing by 2.56% in H1 2020 over the same period in 2019. Facebook is obviously dominated by hardcore games, which occupy 43%. Among the game genres, puzzle game advertisers have the highest share of 18.79%, but arcade game advertisers have the largest increase, 4.81% higher than the same period in 2019.
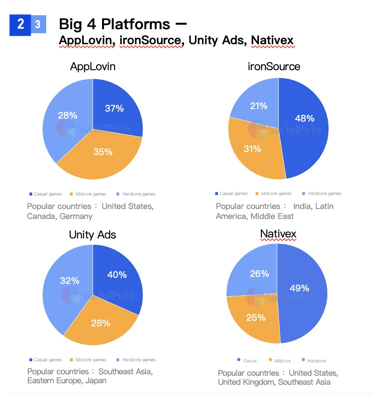
In spite of Google Ads and Facebook’s dominance in the global market, ironSource, Unity Ads, AppLovin and Nativex rose in the outburst of global gaming to grab 43% of the creative in the game app advertising market in H2 2019.
All the four networks have the highest proportion of casual game creative, with Nativex having nearly 50%, followed by ironSource, 47%. The United States, where the most mobile game creative is advertised, occupies the top spot in many hot networks rankings.
In terms of short video networks, TikTok and other short video apps have swept across the globe, with more advertisers trusting them with their ad creative. SocialPeta starts from short video channels in the Chinese market and proceeds to the advertising trend of global short video channels.
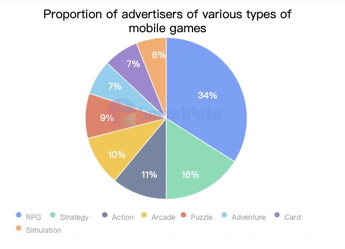
After checking Chinese mainstream short video platforms (douyin.com, ixigua,com, huoshanzhibo.com, pipixia, kuaishou.com, tudou.com), it is observed that the largest share of 34% in H1 2020 goes to RPG advertisers, followed by SLG and ACT advertisers, accounting for 16% and 11%, respectively.
Given the trends in quantity of advertisers and creative in major markets, all have been impacted by COVID-19 without much discrimination.
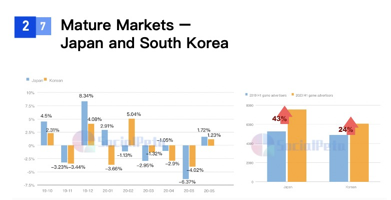
The US, due to the COVID-19 outbreak and the unstable social environment, saw declining active creative starting May. China had declining active advertisers and creative starting March, not showing signs of recovery until June. Japan’s active advertisers continued to decrease quarter-on-quarter after February 2020 due to the pandemic, while South Korea posted a modest increase of ad creative in February, which then fell into decline in March; however, with the pandemic contained, the figures of both markets rebounded in June. European markets had quite different performance: The UK had little change into 2020, except a surprisingly slight rise. Germany had a slight drop in May, but was also relatively stable. In emerging markets, both India and Indonesia started a significant decline in March. Brazil was hard-hit by COVID-19, but its government didn’t force quarantine, so the overall trend in the quantity of advertisers and creative went upward. In Russia, owing to the outbreak of COVID-19, active advertisers decreased slightly in April, but there was a significant increase in May, and the trend then remained stable.
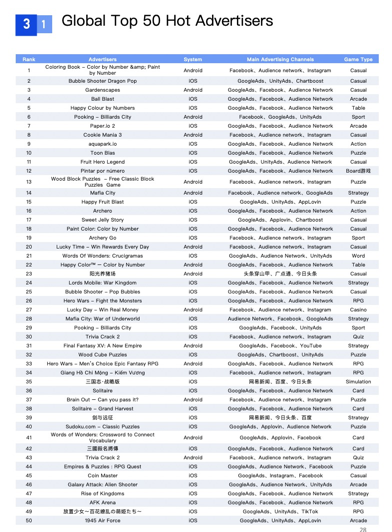
SocialPeta also gives a snapshot of the global top 50 hot advertisers. All the top 3 advertisers in the charts are casual games. The vast majority of the games are iOS advertisers while Android advertisers only occupy 15 seats in the top 50. Internet-monetizing games also have impressive performance in terms of traffic buying. Color fill as a game genre is also quite worthy of attention. The chart-topper Coloring Book – Color by Number & Paint by Number has garnered a super-high popularity value of over 2.2m after more than 220 days of advertising.
The white paper also presents a few hot advertisers for advertising data analysis, including SLG Rise of Kingdoms, combat game Brawl Stars, match-3 game Cookie Mania 3, and hyper casual game Army Clash, summarizing the characteristics of ad creative in H1 2020, and providing the guidelines on ad creative optimization for mobile otome games, hyper casual games, Money-making online games, and ring-pull puzzle games.
MONETIZATION
The monetization chapter is based
on the comprehensive analysis of TopOn, a global mobile ad mediation and
monetization platform. The advertising monetization data is cumulatively
generated from January to June 2020, based on 3000+ cooperative games, 25 million+
daily active users, 200 million+ daily ad impressions, 1 billion+ daily
requests. The data from European, American, Japanese, Korean, and Chinese
markets accounted for more than 90% of the total.
Performance of Global Mobile
Games’ Ad Monetization
From the perspective of game type and advertisement style, the rewarded video eCPM of hardcore games has the best performance, reaching $47.45 on iOS devices, which is nearly four times higher than that of casual games with the most widely used advertising monetization. In the same type of games, eCPM of iOS devices has an advantage over Android’s, which is about 35% higher overall.
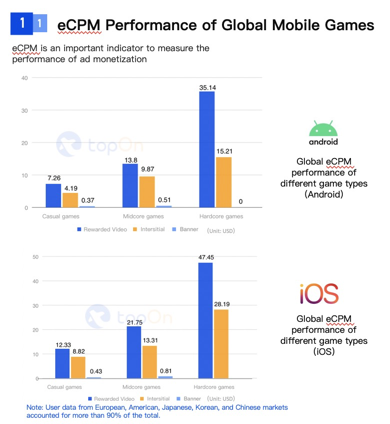
In terms of advertising revenue contribution, in casual games, interstitial advertising has the largest contribution, accounting for 53.82%, followed by 40.47% for rewarded video. In midcore games, rewarded videos that contribute to improving the gaming experience contribute more, accounting for 73.46%, interstitial and banner ads that affect users’ gaming experience account for a total of 26.54%. Hardcore games basically do not consider interstitial and banner ads, so the rewarded video contributed 99.78% of advertising revenue. Hardcore games basically do not consider interstitial and banner ads, so rewarded video contributed 99.78% of advertising revenue.
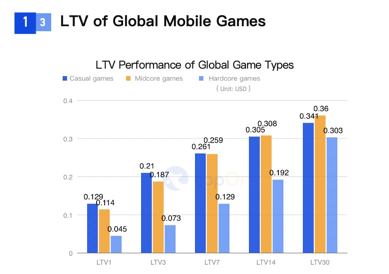
As an important indicator to show the revenue value created by users in the game life cycle, LTV is also applicable to show the advertising revenue contributed by users in game. From the data provided by TopOn, casual games have the highest LTV in the early stage. Due to the better long-term retention of midcore games, their LTV gradually overtakes casual games. Although eCPM of hardcore games is significantly higher than that of other game types, their LTV of ad is low. Because the revenue of hardcore games mainly come from in-game purchase, and rewarded videos are more used as tools to help improve user engagement and increase in-app purchase rate.
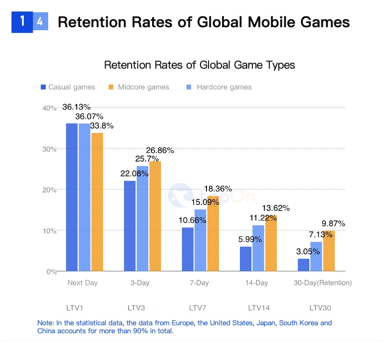
In terms of the retentions rates of major countries, casual games 1-day retention is the highest with 36.13%: casual games are easy to play and highly adaptable to users, so the stickiness of users and the frequency of games are higher in the short term. Midcore and hardcore games have surpassed casual games from the beginning of 3-days retention, and by 30-days retention are 4%-7% higher than casual games.: as the gameplay of midcore and hardcore games is more complex than that of casual games, users are more loyal and the overall stability is better.
Casual Games: Global Performance
of Ad Monetization
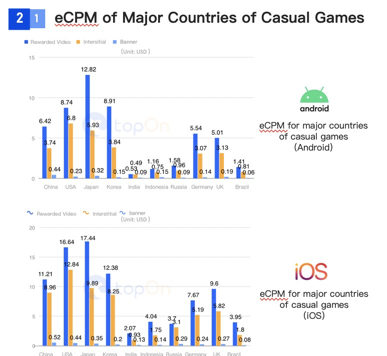
From the perspective of casual games, the median eCPM in Japan among the major countries that rewarded videos is the best, with $12.82 on Android and $17.44 on iOS. Interstitial performance of the United States ranks first in both Android and iOS at $6.8 and $12.84 respectively. China’s overall performance on Android and iOS ranked fourth after the United States, Japan and South Korea, only the interstitial eCPM on iOS is slightly higher than that of South Korea, at $8.96 and $8.25 respectively. The eCPMs of rewarded video and interstitial are the lowest in India, especially Android eCPM is less than $1.
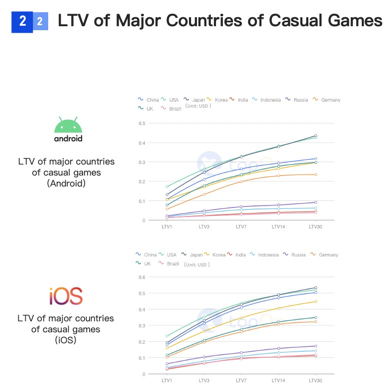
From the perspective of LTV, LTV1 of the United States performs best on both ends, with Android $0.17 USD. The LTV of iOS devices is 26% higher than Android ones, about $0.23 USD. Since LTV14, both ends of Japan have gradually overtaken United States and reaches the highest LTV30 among all regions. From a global perspective, in the first half of 2020, the LTV value of casual games is ranked in the order of US>East Asia>Europe>Latin America and Latin America.
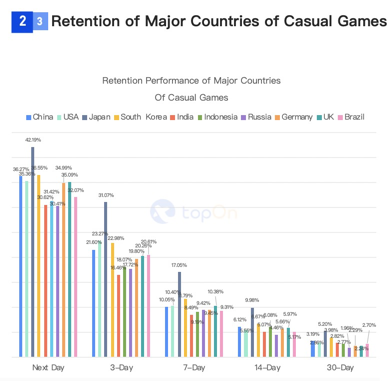
From the perspective of retention, Japan has the highest overall retention rate, with a secondary retention rate as high as 42.19%. Subsequent 3, 7, 14 and 30 retentions are also the highest among all countries. Russia’s overall retention is the lowest, with a second retention of only 30.41%.
Midcore Games: Global Performance
of Ad Monetization
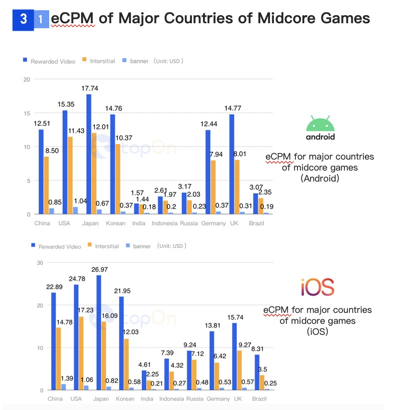
In terms of midcore game, on Android, the highest eCPM was in Japan, where the median rewarded video was $17.74 and the interstitial was $12.01. The US region followed closely behind with $15.35 and $11.43 of rewarded video and interstitial respectively. On iOS, the region with the highest eCPM for rewarded video is also Japan, with a median eCPM of $26.97. US interstitial ads overtake Japan, ranked first with $17.23, India had the lowest eCPM of rewarded video and interstitial, especially for Android at $1+.
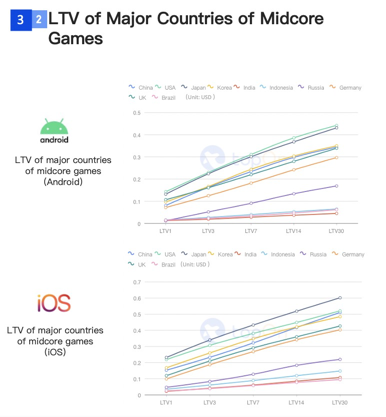
In terms of the performance of LTV, Japan‘s LTV performance in iOS is the best, while the United States performs the best in Android. China ranks fourth on both Android and iOS. The performance of Indian, Indonesia and Brazil in terms of midcore games is relatively average. India has the worst performance on Android and iOS.
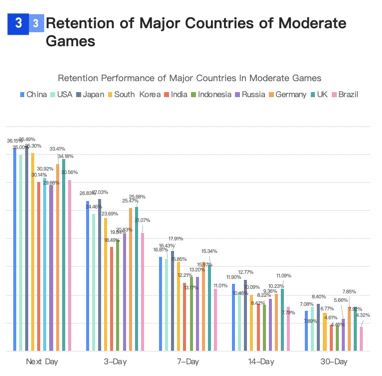
In terms of retention, the overall retention of users in Japan is still the highest, with 36.49% of the secondary retention, but slightly lower than 42.19% of casual games. Russia has the lowest LTV1 rate, less than 30%, but its user stickiness is higher than that of India and Indonesia.
Hardcore Games: Global
Performance of Ad Monetization
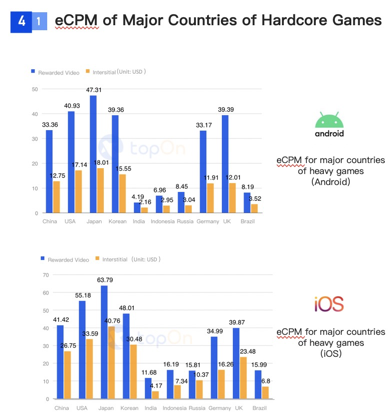
Hardcore games are mainly based on rewarded videos, so the eCPM of rewarded videos in each regions is more helpful for your reference. The top three regions for Android and iOS hardcore games are Japan, United States, and South Korea. In hardcore games, the performance of eCPM in China is similar to or even slightly ahead of that in Europe, which indirectly reflects that users’ purchasing ability has begun to catch up with developed countries.
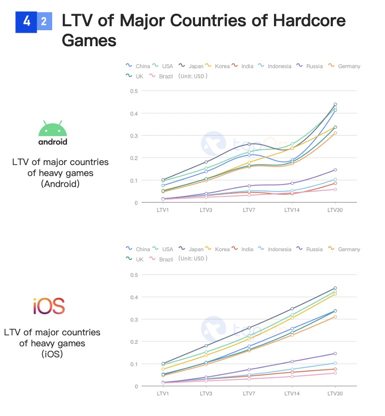
In terms of LTV, the value of users in Japan, the United States, and South Korea is leading the world. LTV30 on Android is higher than $0.3, and LTV on iOS is higher than $0.4. The performance of Japan is the best on iOS, while U.S is leading on Android. The performance of hardcore game in Indian, Indonesia and Brazil are relatively average.
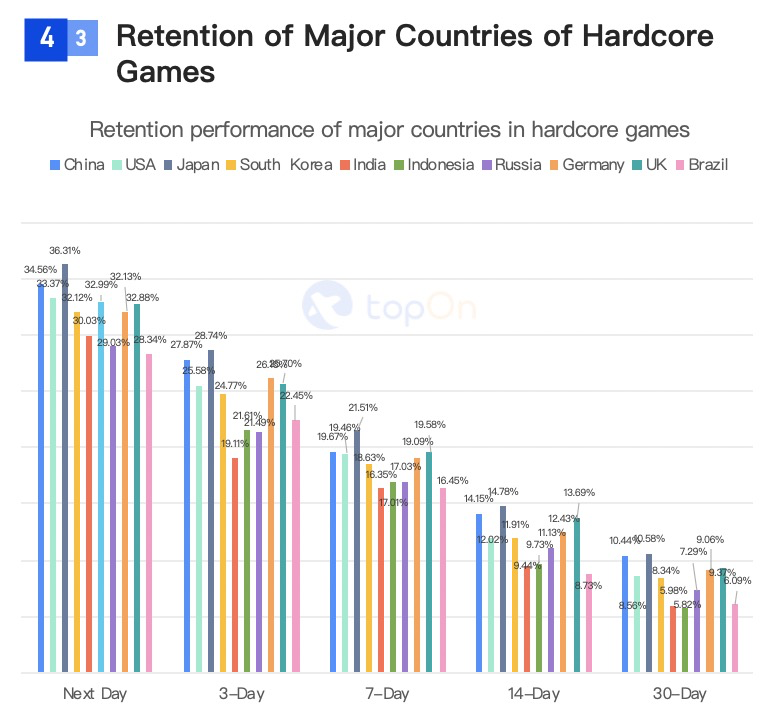
In terms of retention rate, the 2-day retention of hardcore games is generally lower than casual and midcore games. Due to its game characteristics, the overall user churn rate is lower than the other two game types and the user stickiness is higher. Japan has the highest retention rate for hardcore games, while Brazil has the lowest 2-day retention.
Ad monetization performance of major countries
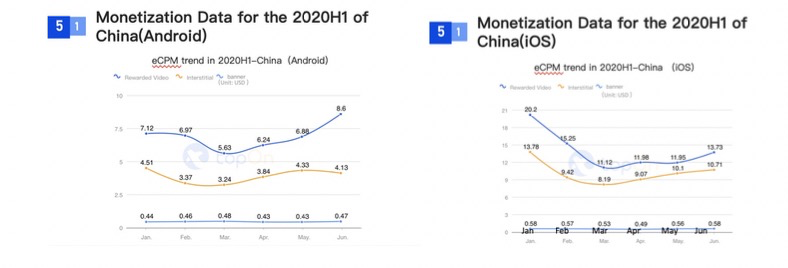
From a national perspective, major global markets have been affected by the COVIC-19 and have experienced a decline in eCPM. The median of eCPM on Android and iOS in Chinese market all entered the lowest performance in March, especially rewarded video on iOS dropped significantly, from $20.2 in January to $11.12.
The eCPM of Android rewarded videos in the United States has been significantly affected by the epidemic. It fell to almost the same as interstitial in April/May/June. eCPM performance: The eCPM of iOS rewarded videos in the United States has gradually declined since March, while, interstitials has gradually increased.

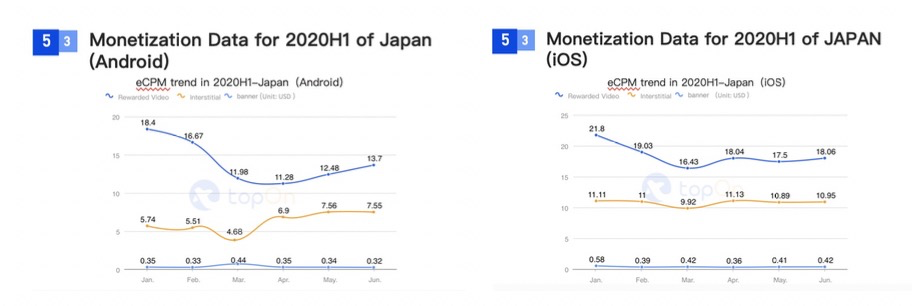
In Japan, the eCPM of Android rewarded videos was also affected by the epidemic, and began to decline sharply in March, after which the eCPM showed a gradual recovery. As in United States, interstitial have been on the rise since April. The eCPM on the iOS in Japan is not significantly affected by the epidemic, the overall performance is relatively stable, and the price is the highest.
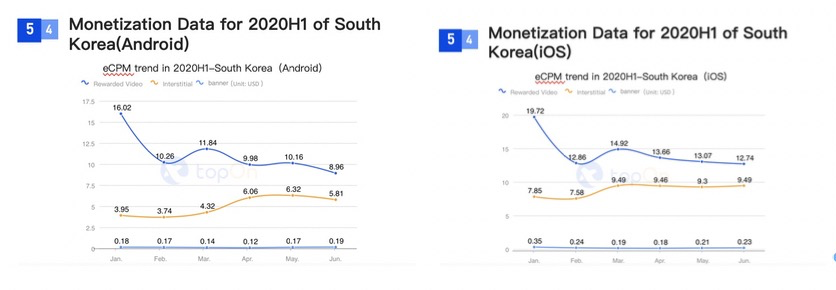
Since February, the eCPM of rewarded videos on Android in Korea has decreased significantly, while interstitial ads have gradually increased since March. The overall rewarded video is relatively flat, and it stabilizes after dropping to the minimum in February; eCPM of interstitial has increased significantly from March to January and February.
The overall fluctuation trend of Europe and the United Kingdom and Germany is smaller than that of the United States, Japan, China, and South Korea. Even the German Android-devices rewarded video and interstitial eCPM are still increasing. The performance of emerging markets is even more different from the performance of the above countries. Although India, Indonesia, Brazil, and Russia have experienced short-term declines in eCPM performance due to the epidemic, the overall growth has increased in volatility. Earlier, according to Google’s observations, mobile game downloads surged in emerging countries during the epidemic. The main factor was the difficulty of migrant workers traveling, which in turn led to a surge in the country’s gaming population, attracting a large number of advertisers to gain users.

